


Scope 1, 2 & 3 Emissions Consultant in India
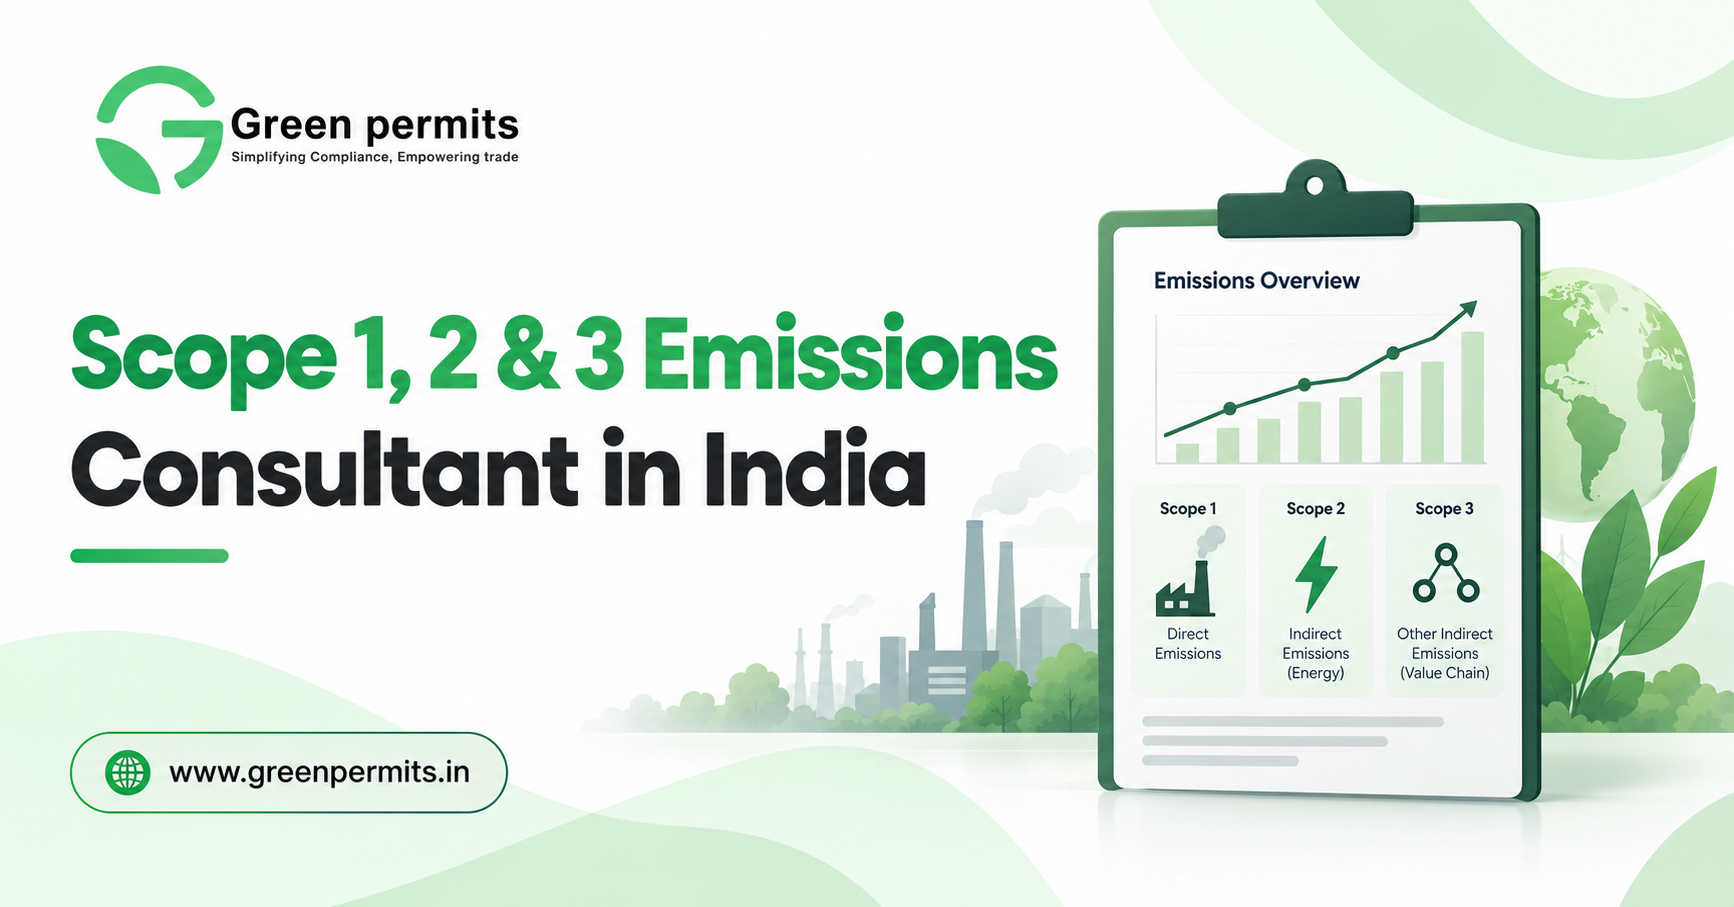
A Scope 1, 2 & 3 Emissions Consultant in India helps companies calculate, organise and reduce greenhouse gas emissions across their own operations, purchased energy and wider value chain. As ESG reporting, customer sustainability requirements, investor expectations and carbon-reduction targets become more important, businesses increasingly need a reliable greenhouse gas inventory rather than approximate emission figures.
For many organisations, the difficult part is not understanding that carbon emissions exist. The challenge is identifying which activities belong under Scope 1, Scope 2 or Scope 3, collecting reliable activity data, applying the correct methodology and maintaining evidence behind every reported number.
Green Permits Consulting supports manufacturers, exporters, corporates and industrial businesses with GHG inventory preparation, Scope 1, Scope 2 and Scope 3 calculations, emission-source mapping, data collection, ESG reporting, BRSR support and carbon-reduction planning.
What Are Scope 1, Scope 2 and Scope 3 Emissions?
Scope 1, Scope 2 and Scope 3 provide a structured way to classify a company's greenhouse gas emissions.
Scope 1 covers direct emissions generated from sources owned or controlled by the organisation. Scope 2 covers indirect emissions associated with purchased energy, particularly electricity. Scope 3 covers other indirect emissions occurring across the company's wider value chain.
The complete structure can be understood as:
Company-Owned Sources → Scope 1
Purchased Energy → Scope 2
Suppliers, Logistics, Products and Other Value-Chain Activities → Scope 3
Separating emissions correctly is important because each category requires different data, calculation methods and reduction strategies.
What is Scope 1 Emission?
Scope 1 emissions come directly from activities under the company's operational control.
For an industrial business, these can include fuel burned in boilers, furnaces, generators, company-owned vehicles or other combustion equipment. Refrigerant leakage from air-conditioning or cooling systems may also create direct greenhouse gas emissions.
A manufacturing facility may therefore collect data such as diesel consumption, natural gas usage, LPG consumption and refrigerant replenishment.
The basic calculation is:
Activity Data × Applicable Emission Factor = GHG Emissions
For example, annual diesel consumption can be converted into carbon dioxide equivalent emissions using the relevant emission factor.
The important point is to identify all material direct emission sources rather than only the largest boiler or generator.
What is Scope 2 Emission?
Scope 2 covers emissions associated with energy purchased and consumed by the company.
For many Indian businesses, purchased electricity is the largest Scope 2 source. A factory, warehouse or corporate office may consume electricity generated from a mix of energy sources outside the company's own premises.
Although the emissions physically occur at the power-generation source, they are associated with the electricity consumed by the business.
A typical calculation is:
Purchased Electricity × Applicable Grid / Electricity Emission Factor = Scope 2 Emissions
Companies operating multiple factories should ensure that electricity consumption from all applicable locations is included consistently.
Where renewable electricity or other contractual energy arrangements are involved, the accounting approach should also be reviewed carefully so that reported emissions accurately reflect the methodology being used.
What is Scope 3 Emission?
Scope 3 is usually the broadest and most complex part of corporate carbon accounting because it covers indirect emissions across the company's value chain.
Depending on the business, relevant sources can include purchased raw materials, capital goods, transportation, employee travel, waste generated in operations, leased assets, product distribution, use of sold products and end-of-life treatment.
For a manufacturer, purchased materials may be far more important than office electricity. For a logistics-intensive business, transportation emissions may be a major contributor.
The objective should therefore not be to collect every possible data point immediately.
A better approach is:
Value Chain Mapping → Identify Material Emission Sources → Prioritise Data → Calculate Emissions
This allows businesses to focus first on the Scope 3 areas that materially affect their carbon footprint.
Why Scope 3 is More Difficult to Calculate
Scope 1 and Scope 2 data are often available within the company through fuel invoices, electricity bills, meter readings and operational records.
Scope 3 information frequently depends on external suppliers, logistics providers, customers and purchasing data.
A manufacturer may purchase hundreds of raw materials from multiple suppliers. Obtaining primary emission information from every supplier may not be practical during the first reporting year.
Companies may therefore need to use a combination of supplier-specific data, activity-based calculations and suitable secondary factors depending on data availability.
The goal should be to improve data quality over time.
A company can begin with a reasonable baseline and gradually move from estimated information toward more supplier-specific and activity-specific data.
Carbon Accounting for Manufacturing Companies
Manufacturing companies usually have emissions distributed across several operational areas.
Scope 1 may include boilers, furnaces and company vehicles. Scope 2 can include electricity consumed by manufacturing equipment, utilities and buildings. Scope 3 can include raw materials, inbound transportation, outsourced processing, employee travel and distribution.
The carbon inventory should therefore follow the operational flow of the business:
Raw Materials → Transport → Manufacturing → Electricity & Fuel → Finished Goods → Distribution → Customer
Mapping emissions along this chain helps management understand where the largest carbon hotspots exist.
It also prevents the company from spending significant resources reducing a small emission source while ignoring a much larger source elsewhere in the value chain.
Data Required for Scope 1, 2 and 3 Calculation
Reliable carbon accounting depends on reliable activity data.
For Scope 1, companies may need fuel consumption, refrigerant records and company-vehicle information. For Scope 2, electricity bills and meter data are usually important. Scope 3 can require purchase quantities, logistics distance, waste records, business travel and supplier information.
Each figure should ideally have a traceable source.
The reporting structure should therefore follow:
Activity → Data Owner → Source Document → Calculation → Emission Result
For example, electricity data may be owned by the facility team, fuel records by operations, employee travel by administration and purchasing data by procurement.
Defining ownership makes future annual reporting much easier.
Organisational and Reporting Boundaries
Before calculations begin, the company should define which operations are included in the GHG inventory.
A business may have factories, warehouses, corporate offices, subsidiaries and leased facilities. If reporting boundaries are unclear, one year may include a location that another reporting year excludes.
This can make emissions trends misleading.
A carbon consultant should therefore establish the reporting boundary before requesting data.
The same principle applies to the reporting period and treatment of joint ventures, leased assets or outsourced operations where relevant.
A consistent boundary allows the company to compare its emissions performance over time.
Calculating Carbon Intensity
Absolute emissions are important, but they do not always show whether operational efficiency is improving.
A company that expands production may report higher total emissions even if emissions per tonne of product have fallen.
For this reason, businesses can also calculate carbon-intensity indicators such as:
tCO2e per Tonne of Production
tCO2e per ₹ Crore Revenue
tCO2e per Unit Manufactured
The most useful intensity metric depends on the industry.
Carbon intensity can help management compare sites, products and reporting years more meaningfully.
Scope 1, 2 and 3 Emission Reduction Strategy
Once the baseline inventory is prepared, the next step is to identify practical emission-reduction opportunities.
Scope 1 reductions may involve fuel efficiency, electrification, process improvement or lower-carbon fuels where technically suitable. Scope 2 reductions can involve energy efficiency, renewable electricity and better power management.
Scope 3 generally requires a different approach because many emissions sit outside direct company control.
Possible strategies can include supplier engagement, lower-carbon raw materials, logistics optimisation, packaging redesign and circular-economy initiatives.
The process should be:
Baseline → Hotspot Identification → Reduction Opportunity → Investment → Target → Monitoring
Carbon accounting becomes more valuable when it supports actual business decisions.
Scope 1, 2 and 3 for ESG and BRSR Reporting
GHG emissions are increasingly connected with wider ESG reporting and sustainability disclosures.
Companies preparing ESG reports, BRSR disclosures, customer sustainability questionnaires or investor presentations may need reliable carbon information that can be traced back to supporting data.
For this reason, the carbon inventory should not be created independently from the company's wider ESG system.
Electricity, fuel, waste, water, procurement and production data can often support multiple sustainability indicators.
A properly designed system reduces duplication and improves consistency across ESG, BRSR and carbon reporting.
Carbon Reduction Targets and Net-Zero Planning
Companies considering carbon-reduction or net-zero targets should first understand their current emissions baseline.
Setting targets before identifying major emission sources can create unrealistic commitments.
A stronger approach is:
GHG Baseline → Major Sources → Reduction Potential → Investment Requirement → Target
For example, a company may initially expect electricity to be its largest carbon source but discover that purchased raw materials create a significantly larger Scope 3 footprint.
The reduction strategy should therefore be based on actual carbon data rather than assumptions.
Common Carbon Accounting Challenges
One common problem is incomplete data. Some facilities may maintain detailed electricity records while fuel or refrigerant data is scattered across departments.
Another problem is inconsistent units. One plant may report fuel in litres while another records expenditure only.
Scope 3 calculations can become particularly difficult when supplier data is unavailable or procurement descriptions are unclear.
A consultant should therefore establish calculation methodologies, assumptions and data-quality limitations transparently.
The objective is not to make the inventory appear more precise than the available information supports. It is to create a reliable baseline that can improve each year.
How a Scope 1, 2 & 3 Emissions Consultant Helps
A professional Scope 1, 2 & 3 Emissions Consultant helps companies identify emission sources, define reporting boundaries, build data templates, select appropriate calculation methodologies and prepare a consolidated GHG inventory.
The consultant can also identify carbon hotspots, create reduction roadmaps and integrate emissions data into ESG or BRSR reporting.
For manufacturing companies, the assessment can connect carbon performance with energy consumption, production volumes, raw-material sourcing and operational improvements.
The complete process can follow:
Boundary Setting → Emission Mapping → Data Collection → Calculation → Validation → Reporting → Reduction Roadmap
How Green Permits Helps with Scope 1, 2 and 3 Emissions
Green Permits Consulting supports businesses with GHG inventory development, Scope 1 and Scope 2 calculations, Scope 3 value-chain assessment, carbon-footprint analysis, ESG reporting, BRSR support, emission-reduction planning and sustainability strategy.
For industrial companies, we can also connect carbon accounting with energy, waste, environmental compliance and broader sustainability improvement initiatives.
Learn More About Scope 1, 2 & 3 Emissions and ESG Reporting
If your company is preparing a carbon footprint, ESG report, BRSR disclosure, customer sustainability submission or emission-reduction strategy, the first step should be to define the reporting boundary and build a reliable Scope 1, Scope 2 and Scope 3 emissions baseline.
Read more about ESG and sustainability consulting services here:
👉 https://www.greenpermits.in/07/ghg-accounting-consultant-in-india-scope-1-2-and-3/
📞 Get Expert Assistance for Scope 1, 2 & 3 Emissions in India
If you need a Scope 1, 2 & 3 Emissions Consultant in India for GHG inventory preparation, carbon accounting, ESG reporting, BRSR support or emission-reduction planning, Green Permits Consulting can assist with complete assessment, calculation and implementation support.
🌐 Website: www.greenpermits.in
📞 Phone: +91 78350 06182
📧 Email: wecare@greenpermits.in

 English
 Arabic
 French
 Spanish
 Portuguese
 Deutsch
 Turkish
 Italiano
 Russian
 Romaian
 Portuguese (Brazil)
 Greek
Greek
 Bengali